Tearsheet Studio / CSV to chart
Turn a CSV into charts, without a chart wizard
Charting a CSV usually means a spreadsheet, a pivot table and ten minutes of formatting. Here you pick the measure and the category, and the charts are drawn for you.
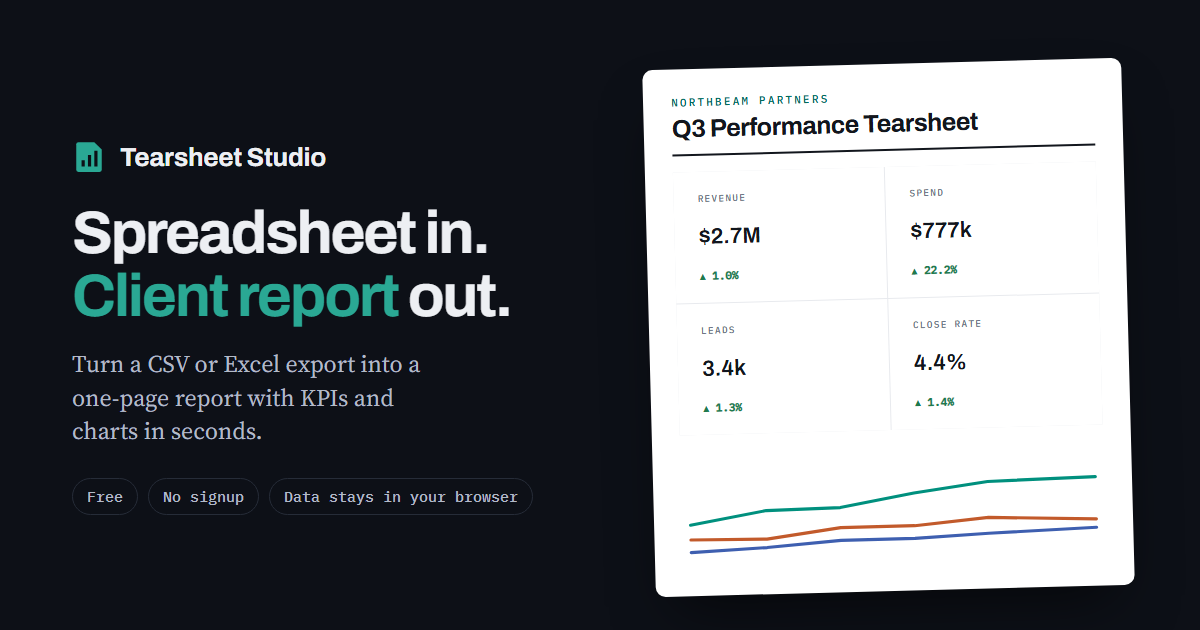
The charts you get
- A line chart over time, split by up to six categories and labelled at the end of each line, so there's no legend-hunting
- A ranked bar chart of the top eight categories, with the value on each bar
- A share-of-total bar showing each category's slice of the whole
- A small trend line inside each headline figure
How to make them
- Import the CSVThe delimiter, header row, dates and number format are detected automatically.
- Pick the measure and the categoryFor example revenue by channel, or orders by region. Choose the time grouping: day, week, month, quarter or year.
- ExportDownload the page as a PNG image or a PDF. To export only the charts, hide the other sections first.
Sensible by default
Lines are labelled directly and every bar shows its value, so nobody has to match colours against a legend. Amounts are totalled and percentages averaged, so a rate never gets added up into a meaningless number.
This isn't a general chart builder: there's no scatter plot, pie chart or custom axis. It draws the charts a report needs. For free-form charting, a spreadsheet or a dedicated charting tool is the better fit.
Questions
Can I download just one chart?
The PNG export captures the whole report. Hide the sections you don't need first, and you get just the chart you want.
Which CSV formats work?
Comma, semicolon, tab and pipe separated files up to 25 MB, including European number formats like 1.234,56.
Is my CSV uploaded?
Your file is read inside your browser tab. It is never uploaded, so there is nothing to delete afterwards.
Can I change the chart colours?
You can set the report's house colour. The category colours are fixed so they stay distinguishable from one another.