Tearsheet Studio / KPI report
A one-page KPI report from your spreadsheet
A KPI report should make the important numbers impossible to miss. That means showing only a few, each with context: which way it moved, by how much, and compared with what.
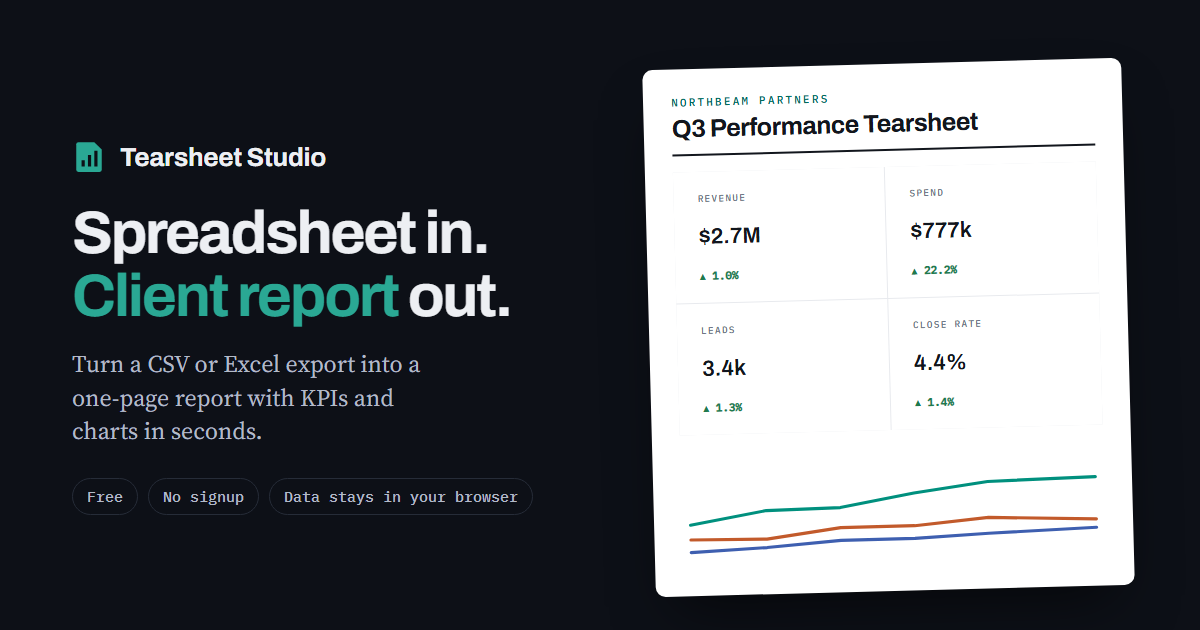
Choosing the KPIs
- Pick three or four. More than that and none of them stand out
- Choose one per question the reader actually asks
- Pair a volume with an efficiency measure, such as revenue with ROAS or leads with cost per lead
- Prefer numbers the team can influence
Context on every number
Each headline figure shows the latest period's value, its change against the previous period or the same period last year, and a small trend line. Percentages change in percentage points, so a rate moving from 4.3% to 4.4% reads as +0.1 pp, not as a misleading +2%.
Pick the period
- Group the data by day, week, month, quarter or year
- Show the latest period with a comparison, or all the filtered data as a single total
- Narrow it to a date range or a single category with the filters
Questions
Can I show more than four KPIs?
Headline figures are capped at four, on purpose. Put the rest in the detail table, where they're available without competing for attention.
Can I set targets?
Targets aren't built in. State the target and progress in the commentary, next to the numbers it refers to.
Which files work?
CSV, TSV, XLSX and XLS files up to 25 MB.
Is my data private?
Your file is read inside your browser tab. It is never uploaded, so there is nothing to delete afterwards.