Tearsheet Studio / CSV to dashboard
Make a dashboard from a CSV file
Not every question needs a BI tool. When you want a clear snapshot of one export, like this month's campaigns, a sales pipeline or a budget, a one-page dashboard is quicker to build and easier to share.
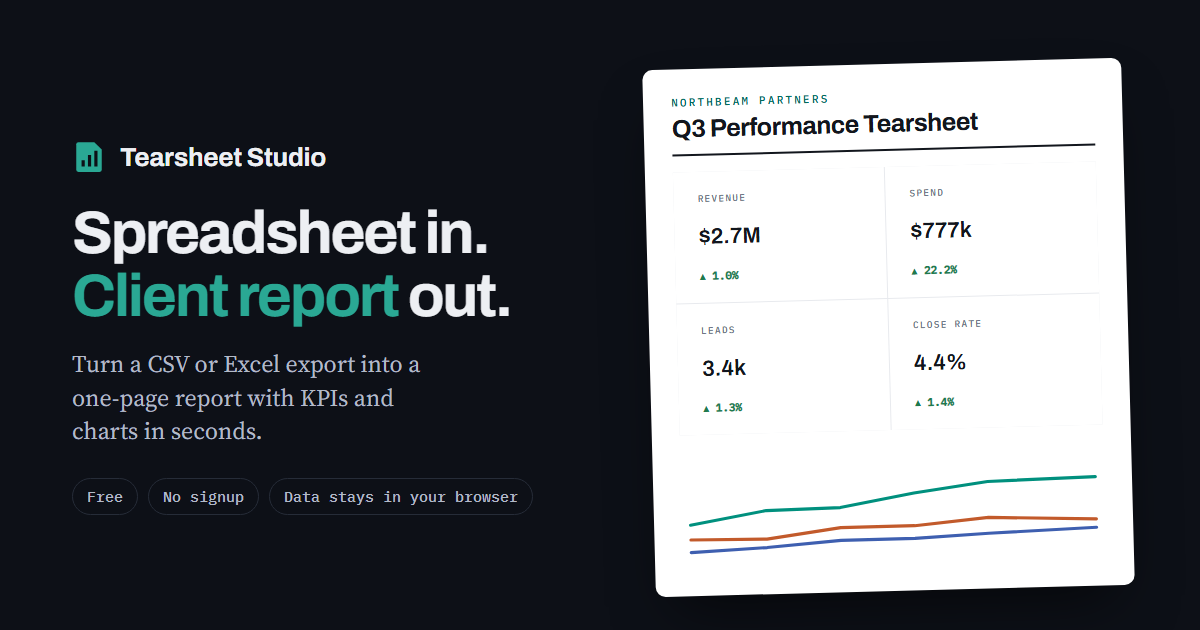
What's on the dashboard
- Headline figures (KPIs) with the change against the previous period or the same period last year, and a small trend line
- A trend chart grouped by day, week, month, quarter or year, split by up to six categories
- A ranking of the top categories and each one's share of the total
- Filters for a date range and a single category
- A detail table with the columns you choose
Numbers combined the right way
Each measure can be totalled, averaged, or shown as a median, minimum, maximum or count. By default, amounts are totalled and percentages averaged. That matters: adding up conversion rates gives a meaningless number.
Calculated metrics such as return on ad spend are worked out as a ratio of totals (total revenue ÷ total spend), not an average of per-row ratios, which quietly overweights small rows.
What it isn't
It isn't a live dashboard connected to your database or ad accounts. It's a snapshot of the file you import. When a new export arrives, import it into a saved template and the dashboard rebuilds with the same layout.
Questions
Can viewers filter the dashboard?
You filter while building. What you share (PDF, PNG or HTML file) shows the view you chose, which keeps everyone looking at the same numbers.
How do I share it?
Download a self-contained HTML file, a PNG image, or a PDF. The HTML file opens in any browser without the app.
Does my data leave my computer?
Your file is read inside your browser tab. It is never uploaded, so there is nothing to delete afterwards.
Does it refresh automatically?
No. It's built from a file, not a live connection. Save a template and next month's update takes one import.