Tearsheet Studio / XLSX to dashboard
Turn an Excel sheet into a dashboard, no pivot tables needed
Building a dashboard inside Excel means pivot tables, chart formatting and an afternoon lost to lining things up. Import the sheet here and the dashboard builds itself. You just choose what to highlight.
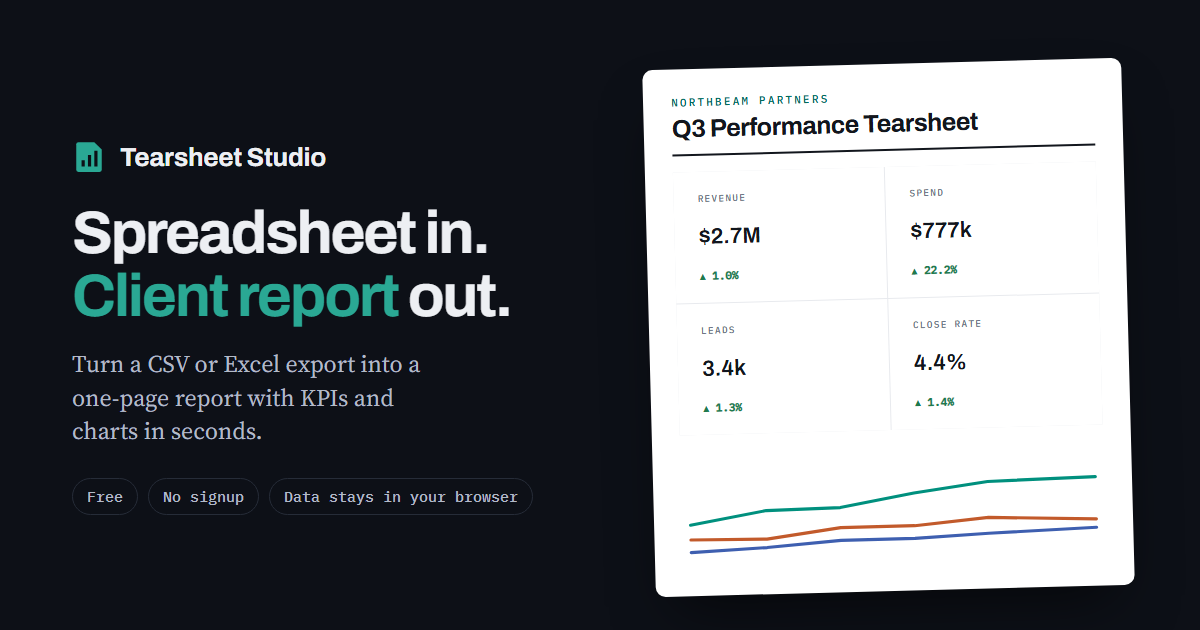
What replaces the Excel work
| In Excel | Here | |
|---|---|---|
| Pivot tables | Build and refresh them by hand | Pick a “break out by” column |
| Charts | Format each one | Consistent charts, built automatically |
| Calculated fields | Formulas you have to maintain | Calculated metrics (A ÷ B, A − B, and more) |
| Months as columns | Transpose or rebuild | Reshaped into a timeline with one click |
| Sharing | Send the workbook | PDF, PNG or a self-contained HTML file |
How to build it
- Open the workbookPick the worksheet and the header row, and check the preview.
- Choose the headline figuresUp to four KPIs, the breakout (channel, region, product and so on) and the time grouping.
- Filter and shareNarrow it to a date range or a category, then export it or save the layout as a template.
Ratios are calculated the way an analyst would: return on ad spend is total revenue ÷ total spend, not the average of each row's ratio, which quietly overweights small rows.
Questions
Do I need pivot tables or formulas?
No. Choose the columns and it groups and totals them for you.
Does it read my formulas?
It uses each formula's saved result. Recalculate and save the workbook in Excel first.
Is my spreadsheet uploaded?
Your file is read inside your browser tab. It is never uploaded, so there is nothing to delete afterwards.
Can I brand the dashboard?
Yes: client name, title, logo, house colour and commentary, plus the order and visibility of each section.