Tearsheet Studio / Sales report
A one-page sales report from your CRM export
A sales report has one job: show whether the number is on track and where it's coming from. Your CRM export already has the rows. This turns them into the page.
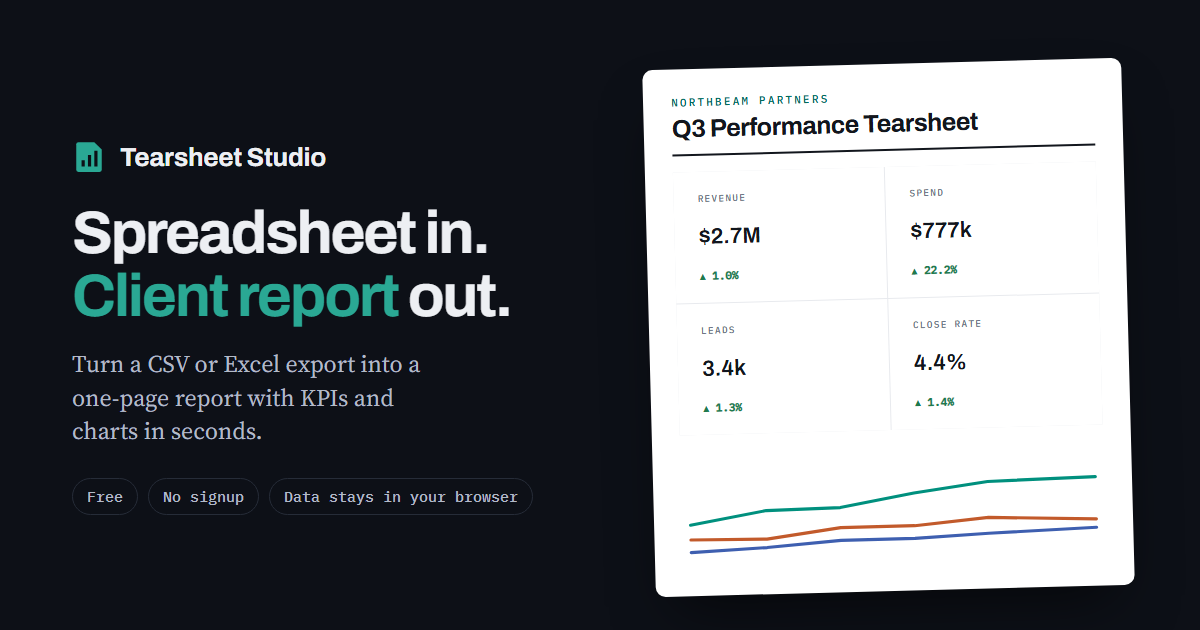
What to put on it
- Revenue or bookings for the period, with the change against the last period or the same period last year
- Deal count and average deal size, calculated as revenue ÷ deals if your export has a deals column
- Win rate as a percentage, which is averaged rather than added up
- A ranking of regions, reps or products, and each one's share of the total
Break it out the way your team is organised
Any text column can be the breakout: region, rep, product line or lead source. Switch it and every chart rebuilds instantly, so the same export can answer “which region?” and “which rep?” without rebuilding anything.
How to build it
- Export from your CRMMost CRMs, including HubSpot, Salesforce and Pipedrive, can export deals as CSV or Excel. Filter to the deals you want (for example, closed-won) before exporting.
- Import and chooseSet revenue as the headline measure and pick the breakout and time grouping.
- Share itAdd commentary, then export a PDF for the team or a PNG for a chat channel.
Questions
Can I show pipeline and closed revenue together?
Filter in your CRM and export each stage separately, or include a stage column and use it as the breakout.
Does it connect to my CRM?
No. It reads an exported file, so there's no login and no API access to set up.
How many reps or regions can it show?
Any number. The ranking shows the top eight, and the share-of-total bar shows the top six with the rest grouped into “Other”.
Is sales data uploaded?
Your file is read inside your browser tab. It is never uploaded, so there is nothing to delete afterwards.