Tearsheet Studio / CSV to report
Turn a CSV file into a one-page report
Drop in a CSV export from an ad platform, a CRM, an accounting tool or a store, and get a report you can hand to a client or a manager. No formulas and no chart wizard.
How it works
- Import the CSVComma, semicolon, tab or pipe separated. The delimiter, header row and date columns are detected for you, and so is the number format, so 1,234.56 and 1.234,56 are both read correctly.
- Choose what mattersPick the headline measure, what to break it out by and the timeline, then up to four headline figures. Need cost per lead or return on ad spend? Add it as a calculated metric.
- Brand it and exportAdd the client name, a title, your logo and a line of commentary. Then print to PDF, save a PNG, or download a single self-contained HTML file.
What the report contains
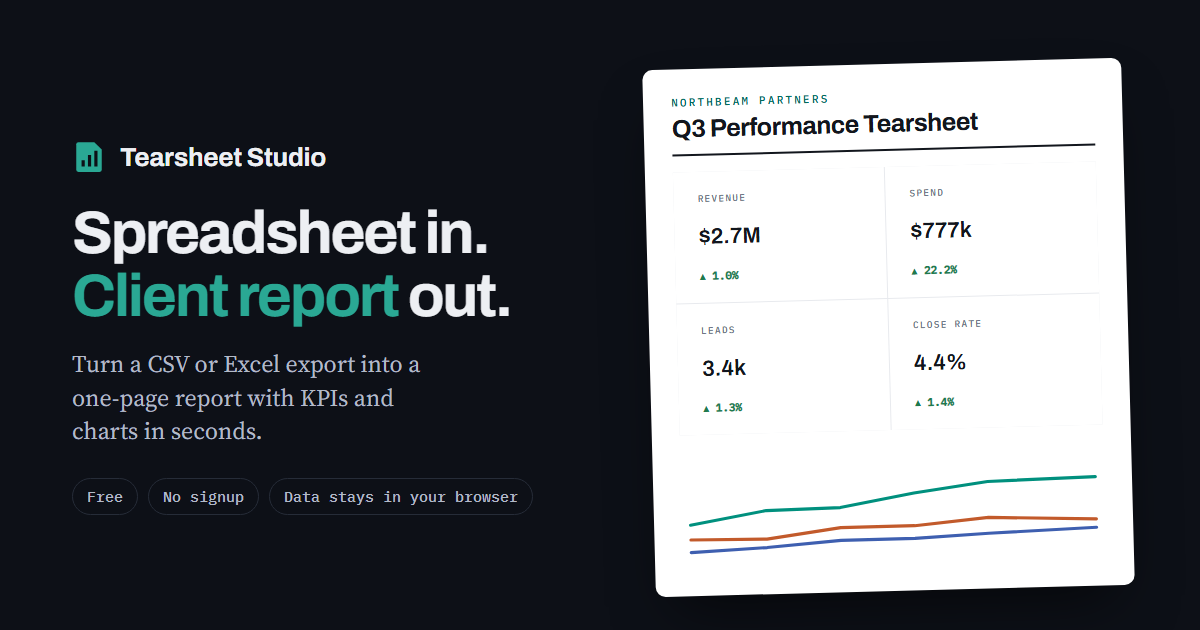
- Headline figures for the latest period, each with the change against the previous period and a small trend line
- A trend chart, split by up to six categories, such as channel, region or product
- A ranking of the top categories, and each category's share of the total
- A detail table with the columns you choose
- Your title, client name, reference, logo and colours
Getting a clean result from your CSV
The report is only as clear as the export it comes from. Three habits help most. Keep one row per date and category, which is how most tools export anyway. Keep the header row to plain column names. And avoid mixing notes into numeric columns, although placeholders like N/A and #DIV/0! are ignored rather than breaking the column.
If your file has months running across the columns instead of down the rows, the app offers to reshape it into a timeline with one click.
Questions
Is it really free?
Yes. Every feature is free, with no account and no usage limit. Exported reports carry a small “Made with Tearsheet Studio” line.
Does my CSV get uploaded?
Your file is read inside your browser tab. It is never uploaded, so there is nothing to delete afterwards.
My numbers use commas as decimals. Will that work?
Yes. The format is worked out column by column, including European 1.234,56, Swiss 1'234.56 and day-first dates. If a column is genuinely ambiguous, the app says so and lets you choose.
How large can the file be?
Up to 25 MB. Larger exports usually contain columns the report does not need, so trim those first.
Can I reuse the layout next month?
Yes. Save it as a template, which stores the settings without the data. Next month, open the template and import the new file. Columns are matched by name.